Chapter 3 Characterizing Infectious Disease States
3.1 Overview and Learning Objectives
In this module, we will discuss ways to characterize individuals with regard to their infection status, e.g. susceptible, symptomatic infected, revovered and immune. We will consider why some infection states are important for public health control but less important from an individual patient, medical perspective, and the reverse. We will also discuss the connection between infectious disease states and compartments in computer models.
The learning objectives for this chapter are:
- Ability to accurately categorize infectious diseases according to medical and public health characteristics
- Evaluate the impact of different infection states on medical outcomes and disease dynamics
- Understand how “medical states” (e.g. symptoms) and “public health states” (e.g. infectiousness) do not always overlap.
- Identify the features of infectious diseases that are most important to know for successful intervention planning
- Understand how different infections states are represented in mathematical models
3.2 Introduction
In the previous chapter, we introduced a very simple compartmental systems model for an infectious disease (the SIR model) where individuals were split according to 3 states related to the infectious disease of interest: susceptible, infected (and infectious) and recovered (and immune). Sometimes, placing individuals into one of these 3 categories provides a reasonable approximation of reality. It is easy and thus often a good starting point. However, at some point we might want to categorize infection states of individuals in some more detail. For instance, for a disease like tuberculosis, a large fraction of individuals who are infected are not infectious. Thus, combining all of those who are infected into a single group is not realistic. We have to allow for more distinct categories. there is potentially an unlimited number of states we can consider. For instance for HIV, we could categorize infected individuals into sub-groups based on their CD4 cell count - and the number of such sub-groups is essentially infinite. Fortunately, to get a fairly realistic picture of most diseases, we can usually get away with introducing just some additional categories. The following sections discuss the major categories with regard to infection status of individuals.
3.3 States of Susceptibility
The simplest assumption is to classify everyone as susceptible. While this is true in some instances, e.g. for a newly emerging disease, often this assumption is not justified. Depending on the disease and population, some individuals might not be susceptible, e.g. because they previously had the infection and have natural immunity, or they received a vaccine or they have a genetic make-up that makes them non-susceptible (examples are the CCR5-delta 32 mutation in HIV or the FUT2-G428A for some norovirus strains). The easiest way to deal with individuals who are not susceptible is to “ignore” them, i.e. simply not include them in any models for that disease. Alternatively, if the model has a recovered and immune class, one can place all those individuals in that category.
It gets more complicated if susceptibility is only somewhat reduced. This is common for some vaccines, which often do not offer full protection, but instead reduce the chance of getting infected (and if infection occurs, often disease severity is reduced). If you want to account for this, you will have to introduce a new state into your conceptual/mathematical/computer model. For instance you could have a category S of fully susceptible individuals, and a category Sp of partially susceptible. Those individuals would get infected at a lower rate compared to fully susceptible individuals. If reduced susceptibility can wane, e.g. due to the wearing off of a vaccine induced immunity, one might need to include a process in the model by which sp individuals transition back into the S category.
3.4 Exposure
Infection can be defined as the presence and proliferation of microbes in bodily tissue inducing an immune response. This is important to elucidate as exposure to pathogens does not always lead to infection. The establishment of an infection depends on the complex interplay of microbe characteristics (e.g., general pathogenicity, having efficient virulence factors), host characteristics (e.g., target tissue defenses, being immunocompromised), the infectious dose (i.e., how many / what concentration of microbes were transmitted). and even the inoculation event, or route of transmission (e.g., breathing in sneeze droplets, being cut by dirty metal, ingesting contaminated food).
There is no certainty of infection given exposure. The probability of infection given exposure varies greatly among the myriad pathogens and even within taxonomies (e.g., Shigella spp.). In epidemiology, we attempt to estimate this individual risk by approximation through population level data with the calculation of attack rates. An attack rate is not a true rate, but rather more akin to cumulative incidence, a proportion (i.e., if a group of people are all similarly exposed, what proportion of them will actually progress to infection).
Infectious disease models largely incorporate this concept of exposure into the transmission rate, b. However, b can be thought of as the combination of epidemiologically-relevant contact rates and the probability of transmission given that contact. In that way, the uncertainty of infection given exposure is accounted for.
3.4.0.1 Notes
This definition of exposure does not align with the commonly-used Exposed compartment found in SEIR models. While our explanation of exposure refers to a point in time before the establishment of infection, the Exposed compartment in SEIR models represents infected persons during the latency period (further discussed in the Pre-symptomatic State section). This is one of many possible examples where infectious disease terminology and modeling lingo do not match. So, always be sure to meticulously and thoroughly read model descriptions to avoid any confusion and/or error.
3.5 States of Infection
Categorizing individuals beyond the simple infected and infectious category is often the most important addition to a model if one wants to make things more realistic. Several important states are commonly distinguished and described in the next few sections.
3.5.1 Pre-symptomatic State
Many important diseases (e.g. HIV, Tuberculosis), have a state during which an individual is infected but does not show any symptoms. There are different labels for this pre-symptomatic stage. Terms that are often used are latent, exposed or incubation period.
Pre-symptomatic infected individuals might (HIV) or might not (TB) be infectious. Some authors use the term latent or exposed specifically for a pre-symptomatic stage in which an individual is non-infectious, while incubation period usually refers more specifically to the time before symptom onset. However there is no fully standardized terminology and these terms are at times used interchangeably. The context generally makes it clear what is meant.
It is important to keep in mind that infectiousness and symptoms are not always overlapping. The former is the most important driver of the ongoing infection process and drives the observed disease dynamics on the population level. The latter is important for surveillance and medical interventions. Moreover, how well the latency and incubation periods align can create some interesting infectious disease scenarios. As briefly touched on with HIV, there may exist an asymptomatic (or pre-symptomatic) infectious period if the latency period is shorter than the incubation period. TB offers a rather rare example whereby the latency and incubation are well aligned, at least by definition. A latent-TB infection is considered non-infectious and without symptoms. When symptoms develop, it is then possible for Mycobacterium tuberculosis bacteria to be transmitted in the air, marking the end of both the latency and incubation periods. As a final example, ebola demonstrates latency which extends past the incubation. That is, ebolavirus transmission is possible only after the infected person has been experiencing symptoms for several days.
3.5.2 Asymptomatic State
For almost all diseases there is a pre-symptomatic period before symptoms appear. This can be a very short time (hours), or can be years. While many diseases eventually lead to some amount of symptoms/morbidity in at least some infected individuals, there are also many infectious diseases that might never lead to symptoms, at least in a fraction of infected individuals. The importance of fully asymptomatic infections depends strongly on the pathogen. On the one extreme are pathogens like Ebola or HIV, who produce symptoms in a large fraction of individuals, either pretty quickly (Ebola) or after an extended period (HIV). The other extreme are many chronic viral infections, e.g. many herpes viruses that often do not lead to any symptoms in infected individuals.
During the asymptomatic state, individuals might or might not be infectious. If they are infectious and do not show symptoms, they are a potentially important source of ongoing transmission of the pathogen. For many sexually transmitted diseases, this is the case. Since asymptomatic individuals are often not picked up by surveillance, they can pose problems for the control of a disease.
Note that some diseases can show complicated patterns of symptoms, e.g. for malaria symptoms can be intermittent, with periods of no symptoms in between.
3.5.3 Symptomatic State
From a purely medical perspective, focusing on one patient at a time, the most important characteristic of a disease is its severity, also called morbidity. We would like to know what kind of symptoms a disease produces and how frequently those occur. This is the morbidity profile of a disease. One can consider mortality the “ultimate symptom.” Because of its importance, mortality is often considered separate from morbidity. Knowing morbidity and mortality of an ID are generally most important when caring for individual patients. For interventions, understanding what might help mitigate morbidity and mortality is of prime interest.
Most diseases lead to a state with morbidity, i.e. where an infected individual shows symptoms. Those diseases that don’t are usually not of much medical and public health interest. During the symptomatic state, individuals are generally infectious. The question how symptoms might or might not impact infectiousness is important but not too well understood. Qualitatively, we know that coughing and sneezing help spread many respiratory pathogens, while the symptoms an HIV infected individual displays during the AIDS stage are likely not increasing infectiousness. The connection of symptoms, morbidity and mortality and its relation to infectiousness is the main theme underlying the topic of virulence, which we’ll cover later in the chapter on virulence evolution.
Morbidity and mortality are also often important for public health surveillance. It is generally difficult to capture infected individuals that do not show symptoms, those that are symptomatic - and obviously, those that die - are easier to count and thus get estimates for disease prevalence and incidence.
3.6 Post-infection States
After infection is over, it is possible for an individual to enter different states. So far, we only considered a recovered and immune state. in the classic SIR model, those R individuals are immune forever and thus do not further influence the systems dynamics. However, some infectious diseases either do not induce immunity (e.g. many sexually transmitted diseases) or only lead to short-term immunity (e.g. norovirus or influenza). If a disease does not induce immunity, one can conceptualize and model this by assuming that after infection, individuals directly enter the susceptible state again (leading to the SIS model).
If we assume that everyone has immunity only for a short period of time, we can account for that by having infected individuals first enter the recovered state, and then from that state move at some rate back to the susceptible state (leading to the SIRS model).
Things can get more complicated when combined with different infection states. For instance it might be that those individuals who had an asymptomatic case of the disease acquire immunity that wanes more quickly compared to those who were symptomatic infected. We then need to have 2 different recovered compartments, each with its own rate of returning to the susceptible state.
A special and important post-infection state is death. From a ID dynamics perspective, a dead person generally behaves like a recovered and immune person, i.e. they do not further influence the infection dynamics (ignoring special cases such as e.g. Ebola where transmission after death has been observed). Of course, from a medical and public health perspective, a recovered and immune person is a favorable outcome while a dead person is not.
3.7 Medical versus ID Dynamics Perspectives
I hope that the above description of different states made it clear that features that are important from a medical perspective (e.g. severity of symptoms), might or might not be important for understanding the dynamics of the disease. To properly study the dynamics of an ID, we need to know when someone is infectious (e.g. before/without symptoms, or only when symptomatic), how transmission occurs, if recovered individuals become immune, if immunity is waning, etc. The difficult part is that our data often comes from clinical (symptomatic) cases or deaths. If asymptomatic individuals are infectious, or there is underreporting, we often don’t get the full picture. This is discussed further in the surveillance chapter.
Of course, the medical and ID dynamics/epidemiological perspectives are not an ‘either/or.’ Instead, success in combating infectious diseases only comes when all aspects are considered. Still, it is useful to keep in mind that certain infection states are more important when considering how to intervene on the individual patient level versus intervention on a population level.
3.8 Models with More Details
The above sections described different states that might need to be considered and explained. To account for these subtleties imposed by the life histories of infection, we can build the constructs into the infectious disease models. For examples: latency periods are often modeled using an additional Exposed compartment, such as in SEIR models; and, complex latency and incubation periods can be adjusted for using additional compartments (e.g., Pre-symptomatic) and/or additional parameters (e.g., separate transmission parameters for Pre-symptomatic and Symptomatic infected compartments).
To illustrate this, figure 3.1 shows a model with additional compartments. We omit showing a mathematical representation (i.e. a set of differential equations) for this model. However, a very similar model, together with the equations, can be found in the DSAIDE app referred to below in the exercise section.
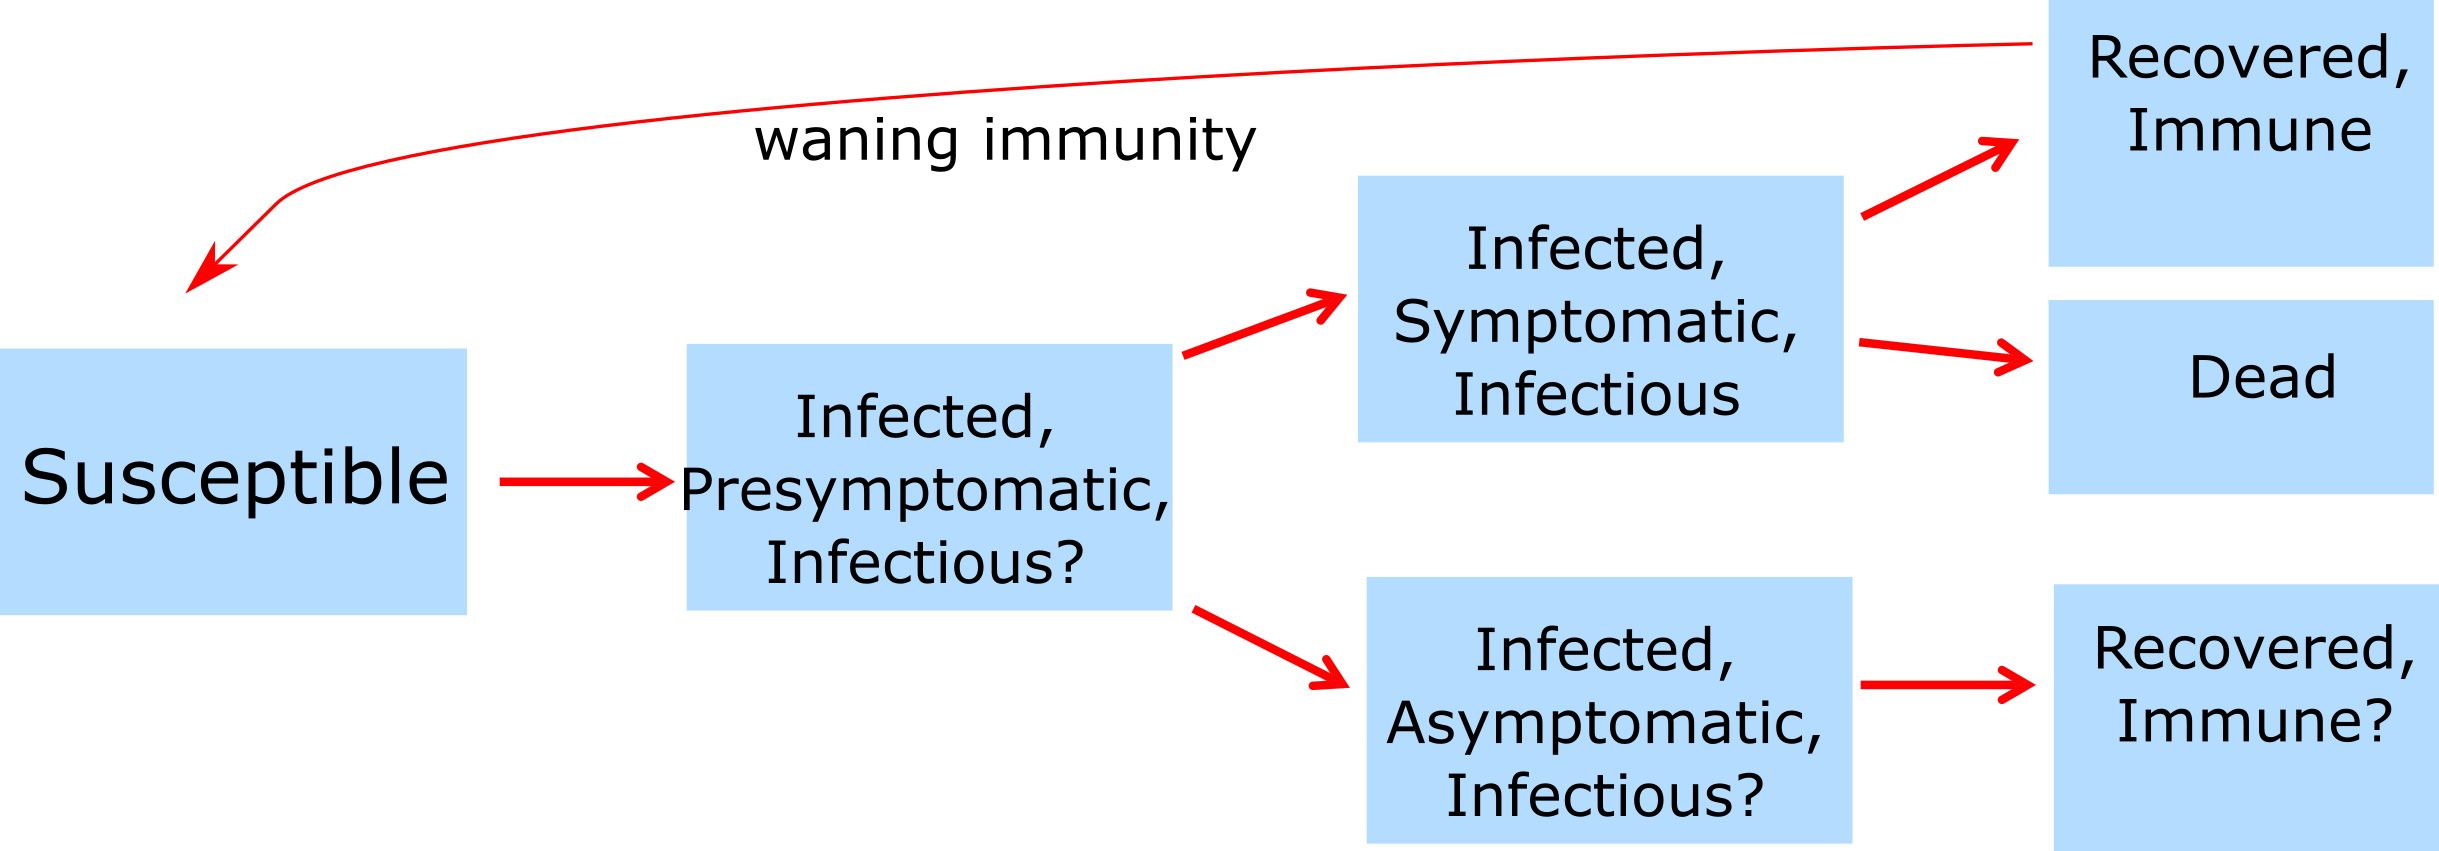
FIGURE 3.1: Example of a model with more compartments.
3.9 The Goldilocks Principle
While we discussed major ways to categorize individuals (e.g. symptomatic versus asymptomatic or infectious vs non-infectious), one can potentially sub-divide any state into as many sub-states as one wanted. For instance one could split infected individuals into 10 different levels of infectiousness. The question then becomes: How detailed and complex should our model be? What details should we include and which ones should we omit? This is an important question and deserves a detailed answer, which I am trying to provide in the Appendix, Chapter 22.
3.10 Case Studies
To come
3.11 Summary and Cartoon
This chapter discussed ways to characterize an individual host’s state with regard to an infection. We discussed the differences between medical and public health perspectives and how ID states can be mapped to models. We also briefly discussed how one should build models that provide the right amount of complexity.
.](images/xkcd-course-of-colds.png)
FIGURE 3.2: Yet another perspective on ID infection states. Source: xkcd.com.
3.12 Exercises
- The Characteristics of ID app in the DSAIDE package provides hands-on computer exercises for this chapter.
- Suggest a real ID that might be approximately described by the Characteristics of ID DSAIDE app. Approximately what values for the different parameters would be appropriate to describe the ID you have in mind? See what you can find for the different parameters of the ID you chose in the literature.
- Read the paper “Modelling an outbreak of an emerging pathogen” by Kajita et al (Kajita et al. 2007). The paper lists 8 assumptions that went into constructing the model. Is there any assumption that you might have made differently, and why? Are there other assumptions the authors make when building the model that are not included in their list of assumptions? If your next step would be to further increase model realism, what would you do, i.e. what feature(s) would you include that are currently not in the model?
3.13 Further Resources
- The following papers provide some additional information on the ideas discussed in this chapter: (P. E. M. Fine 2003; Milwid et al. 2016).
- A good example showing how different assumptions about ID states can lead to different conclusions, and how models can be used to discriminate between alternate hypotheses can be found in (King et al. 2008).