Statistical Analysis Overview
Overview
In this Unit, we will take another look at the whole data analysis process. Here, we focus on the actual (statistical) analysis (which I also call model fitting) component of the data analysis process. A general conceptual understanding is useful before we jump into looking at and applying specific modeling/statistical approaches.
Learning Objectives
- Become familiar with different types of analyses.
- Learn how the type of data determines the modeling approach and be able to choose the right methods.
- Understand the overall goals of fitting statistical models to data.
Introduction
So far in this course, you briefly encountered a few simple statistical models in some of the readings and exercises (e.g., applying a linear model), but we didn’t focus on it. Instead, we looked at a lot of other components that are important for a full data analysis project but are less often taught. You might have come across the statement (e.g., in R4DS) that 80% of the time spent on data analysis is in the non-modeling/non-statistical parts. From my experience, that is true. While the statistical modeling/analysis part is certainly important, it often takes a fairly small amount of the whole project time. And while it is certainly possible to use the wrong statistical model, it seems to me that the most important and consequential mistakes that might invalidate an analysis do not happen in the modeling part. Sure, people often use the wrong statistical method, but that has - in my experience - often surprisingly (and thankfully!) little impact on the results. Not properly cleaning and processing data (e.g., not realizing that weight is reported in pounds and not kilograms when computing BMI) often has a much bigger impact on results.
No matter what statistical analysis you end up using, you will need to do the steps of getting and cleaning/processing/wrangling the data. During that process, you also explore your data, e.g., through plots and tables. Doing those steps efficiently and accurately is crucial. After you are done with the preliminary steps of getting/cleaning/wrangling data, you can move on to your main goal, fitting models to data. Once you reach the stage where you are ready to fit models, most of the hard work is done.
Once you reach the state at which your data is ready for statistical analysis, you should have a good idea of the types of models that might be appropriate. The choice of model is partly driven by the data, and partly by the kind of question you want to answer. There are several reasons why you might want to apply statistical models to your data, we’ll discuss them briefly.
Why fit models to data
There are several reasons why we might want to fit models. The following is a brief list. The next section goes into more detail.
- To produce or test hypotheses (e.g., “there is a (linear) correlation between BMI and diabetes”)
- To estimate parameters (e.g. “a 1 unit increase of particulate matter leads to 2 more asthma attacks per person per year”)
- To draw causal conclusions (e.g. “taking statins causes reduction in cholesterol”)
- To draw mechanistic conclusions (e.g. “interferon reduces HCV virus load by stopping production of new virus”)
- To make predictions (e.g. “exposure to N cholera bacteria leads to an infection with probability p”)
Depending on the objective, you will likely be using different statistical approaches. Note however that there is no clear mapping. For instance you can use a linear model to come up with hypotheses (i.e., do an exploratory analysis), to test hypotheses (e.g., in a clinical trial), to estimate parameters, or make predictions. A lot of models can be used for different purposes. This might be initially confusing. Just keep in mind that while some models are better for some purposes (e.g. a complex machine learning or artificial intelligence model might be good for predictions, but bad for causal conclusions), most models can be applied to more than one type of objective.
Data Analysis Types
The following way of categorizing types of data analyses follows The Art of Data Science (ADS) – specifically, chapter 3. Now might be a good time to give that chapter another quick re-read. A very similar, shortened version of the ADA chapter 3 discussion can be found in Jeff Leek and Roger Peng’s article. The following figure from their paper gives a good summary of what follows.
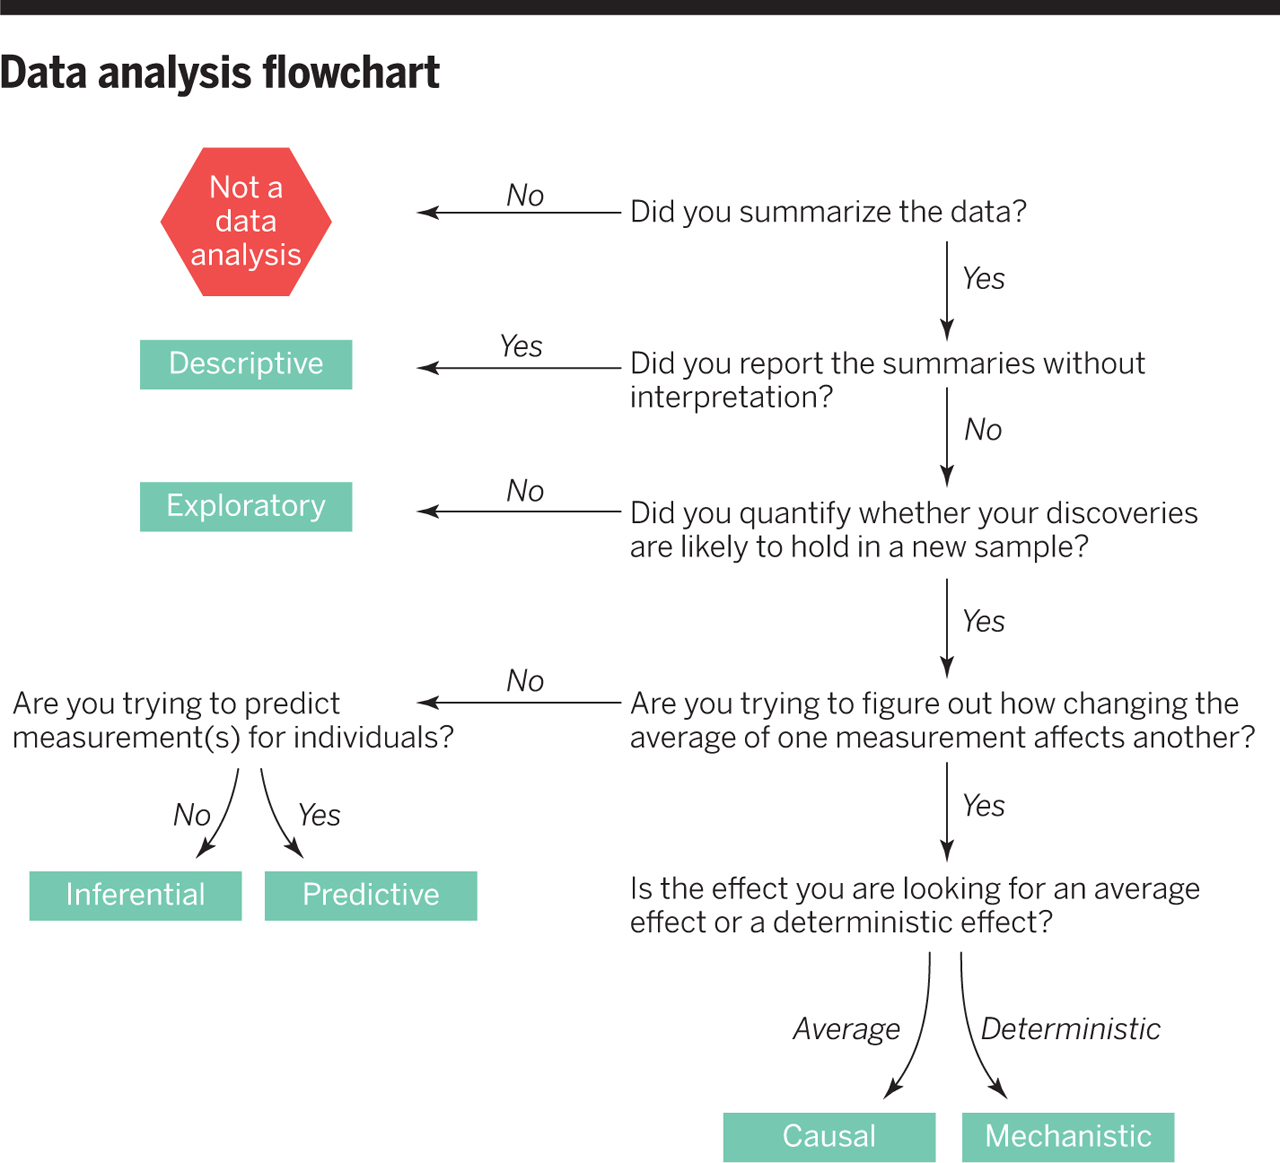
The most straightforward analysis is a descriptive one. At that stage, you process, summarize and present the data, and do not go further. You don’t need to fit any statistical models. A lot of data collected by surveillance systems or government agencies falls into the descriptive category. For most scientific projects, we often start with a descriptive presentation. E.g. Table 1 in a study often describes and summarizes the data source. Note that some authors have the bad habit of including model fitting quantities, such as p-values, in a descriptive table. Measures that involve fitting a model (such as p-values), go beyond a descriptive analysis and should therefore generally not be in a descriptive table.
Sometimes, a descriptive study is interesting and sufficient by itself. But often, we then want to go beyond the descriptive presentation of data. The most common analysis approach is associative. Here, we are looking for associations (i.e., patterns) in the data. We are interested in seeing if patterns exist (e.g., if there is a correlation between age and speed of solving mathematical problems) and what the shape of the pattern is (e.g., linearly increasing/decreasing or non-monotone). This is also called correlation analysis.
Depending on the way we came up with our question and the data, the results from such an associative analysis can be interpreted as an exploratory or hypothesis-generating approach, or an inferential or hypothesis-supporting approach. In general, if you asked the question/posed the hypothesis first, then went out and collected the data and analyzed it to see if your hypothesis holds, you can interpret your findings as supporting or refuting your hypothesis. If you had data that were not collected to answer your question specifically, and you analyzed the data to see if you can find some interesting patterns, then your findings should be interpreted as hypothesis-generating.
For both exploratory and inferential settings, you are usually interested in understanding how specific inputs/predictors affect the outcome(s) of interest. For that reason, you generally want to keep your models fairly simple and easy to interpret.
Essentially all standard statistical tests and approaches you are likely already familiar with (e.g., various statistical tests like t-tests, simple linear regression, or simple classification such as logistic regression) fall into these categories of associative, exploratory, or inferential. We will cover some of those modeling approaches in future units.
Often, we would like to go from association to causation, i.e., we would like to say that not only does an increase in X correlate with an increase in Y, but that X causes that increase in Y. There are two ways of doing so. One is to collect the data in the right way, namely using a randomized clinical trial or equivalent lab science approach where all contributing factors but the input of interest, X, are controlled. This way, we can say that a change in X directly causes a change in Y. If the data does not come from such a study design, methods of causal inference (which we won’t discuss in this course) can sometimes help in trying to determine causality.
Classical statistical models can get us as far as determining potential causal relations. If we want to go even further and not only try to answer if X causes Y, but how X causes Y, we will need to employ studies or models that are mechanistic. Such models explicitly include postulated mechanisms, and by comparing such models to data, one can often determine which mechanisms are more plausible. Mechanistic models are also beyond what we cover in this course (if you are interested in those, I teach two courses on mechanistic modeling in infectious diseases 😃).
While the main goal of science is generally understanding a system as well as possible, outside of science, other goals are often more important. In applied/industry/commerce settings, one often does not care too much if or how exactly certain inputs influence outcomes of interest. Instead, the main purpose is to try and predict future outcomes given a set of inputs. In this case, the interpretability of your model is not that important. Instead, a predictive modeling framework is more important. That’s where complex models, such as machine learning and artificial intelligence (neural net) approaches come into play. Those models are too complex to allow much interpretation and understanding of the system, but often these kinds of models are very good at prediction and real world performance (e.g., differentiating cats from dogs in images).
Examples of data analysis types
An example of an inferential analysis might be the question which, if any, immunological markers (e.g., cytokines in blood) are most influential for a given clinical outcome. Building a simple model here, e.g. a linear model if the outcome is continuous (e.g., blood sugar level) or a logistic model if the outcome is binary (e.g., heart attack within 5 years or not), allows us to quickly and transparently investigate how each variable in our model affects the outcome and which variables (immunological markers) might be important to study further.
A good example of a prediction model is the monitoring of credit cards by the issuing companies, who try to predict fraudulent transactions. To that end, they feed all the data they can get about you into their models, and if something happens that is unusual, you might get flagged, and your card denied, or you will have to call to confirm. In this case, the interest is not too much on how exactly all these data points about you and your behavior lead to the prediction of legitimate vs. fraudulent, only that the accuracy of those predictions is high. Because of this, in situations where prediction is important, models tend to be more complex, and one is willing to trade simplicity and interpretability of a model for increased predictive performance.
Modeling methods based on data
While the goal of the analysis will guide you toward choosing a general type of modeling approach, the data usually dictate in more detail what kinds of models are suitable. The main determinant of the model type to use is the outcome(s) one wants to analyze.
First, is there even an outcome? While the majority of datasets have an outcome(s) of interest, that is not always the case. Data without a clear outcome are sometimes called unlabeled. For instance, we might have collections of images of cell types, and our question is if these images cluster into specific types of cells - without knowledge of what those types might be. Another example is a scenario where we might have a large dataset of customers and lots of information about each customer. We might want to know if those customers can somehow be grouped based on the data we have about them (with the goal to design a marketing campaign directed at specific groups). Methods for those tasks are generally called clustering methods or unsupervised learning methods. Examples are k-means clustering, principal component analysis, and neural networks. (Note that some of these methods can also be used with data that include outcomes.)
The more common data structure is one with a specific outcome(s) of interest. This is also referred to as labeled data. Since labeled data is the most common, we focus on it in this course. In this case, we use approaches referred to as supervised learning methods. Those can be further divided based on the type of outcome. If the outcome is continuous (or can be treated as such), we use regression approaches, or if the outcome is categorical, we use classification approaches.
You are likely already familiar with some of these approaches. Most basic statistical tests are simple models for regression or classification, i.e., they try to detect patterns in data with quantitative or categorical outcomes. Some other statistical methods are generalized linear models (which include the basic linear and logistic models), generalized additive models, trees, support vector machines, neural nets, k-nearest neighbors, linear discriminant analysis, and a lot of further methods, many of which are variants of others. Some, but not all, of the more complex methods can be applied to both quantitative and categorical outcomes. We will cover a few of these methods later in the course.
Note that there is, unfortunately, no one method that is universally best for all data/questions. Both the type of question and the details of the data will influence the model choices. Often, there are several models that would be reasonable choices for a given setting, and in such instances it is often worthwhile (and fairly easy) to explore multiple alternative models.
Further reading
For some additional (as well as overlapping) information to what I wrote, read Chapters 1 and 2.1. An Introduction to Statistical Learning (ILS). You don’t need to work through it in detail and can skip over the math bits if you want to. But do try to get an overall idea of the concepts these chapters are trying to convey. Chapter 1 of HMLR is another good source that you should skim through. Again, try to get the main points (which will of course overlap with the text above and the other readings).
This recent paper A practical guide to selecting models for exploration, inference, and prediction in ecology provides a nice discussion of different modeling goals and what approaches one should use. We have not yet discussed some of these approaches, but will soon. You could skim through the paper now, then revisit later once we covered more of the topics discussed in there.